
CEATEC 2026 / Exhibitor Category Analysis
更新日:2026年9月21日
AIが多い。
でも、それだけではない。
CEATEC 2026の出展者データ390件、96製品カテゴリを集計し、カテゴリ数・共起数・期待共起数・Liftから展示構造を読み解いた。表面上はAIとDXが圧倒的だが、カテゴリ同士の「期待以上の結びつき」を見ると、別の中心が見えてくる。
01 / THE OBVIOUS LAYER
まず見えるのは、AIとDX。
カテゴリ件数ではAI(172)が最大で、DX(143)が続く。次いでIoT(73)、ソリューション・サービス(69)、アプリケーション/ソフトウェア(68)。ここまでは、2026年のテクノロジー展示会として驚きは少ない。
たとえばAIは172社、DXは143社と、そもそも多くの出展者に付いている。大きなカテゴリ同士は、それだけで同じ会社に付く機会も増える。そこで次は、カテゴリの大きさをいったん差し引いて考える。
02 / BEYOND COUNTS
「多い」ではなく、「期待以上に一緒にいる」を見る。
ここでは、まず「2つのカテゴリに特別な関係がないとしたら、何社くらい両方に入るだろう?」という基準を置く。これを本記事では期待共起数と呼ぶ。たとえばAIは172社、DXは143社なので、390社の中で両者が無関係に付くと仮定すると、両方に入るのは約63.1社と見積もられる。
実際にはAIとDXの両方が付いた出展者は104社だった。104 ÷ 63.1 ≒ 1.65。この「実際の重なりが、無関係と仮定した場合の何倍か」をLift(リフト)と呼ぶ。Liftが1ならほぼ期待通り、2なら期待の約2倍一緒に現れている、という読み方だ。
つまりAI×DXは確かに強く結びついている。ただしTOP20カテゴリ全体で比べると、さらに「カテゴリの大きさだけでは説明しにくい」組み合わせが見つかる。
| カテゴリの組み合わせ | 実共起 | 期待 | Lift |
|---|---|---|---|
| スマートシティ × 公共インフラ・サービス | 36 | 8.8 | 4.10 |
| モビリティ × 産業用ロボット | 20 | 5.8 | 3.44 |
| 科学技術/先端技術 × 産学/知財/人材 | 21 | 6.2 | 3.39 |
| スマートシティ × 環境・エネルギー | 19 | 5.7 | 3.31 |
| スマートシティ × モビリティ | 26 | 8.2 | 3.18 |
| ソリューション・サービス × アプリ/ソフトウェア | 35 | 12.0 | 2.91 |
| IoT × ソリューション・サービス | 32 | 12.9 | 2.48 |
| AI × DX | 104 | 63.1 | 1.65 |
| DX × アプリ/ソフトウェア | 42 | 24.9 | 1.68 |
| AI × IoT | 48 | 32.2 | 1.49 |
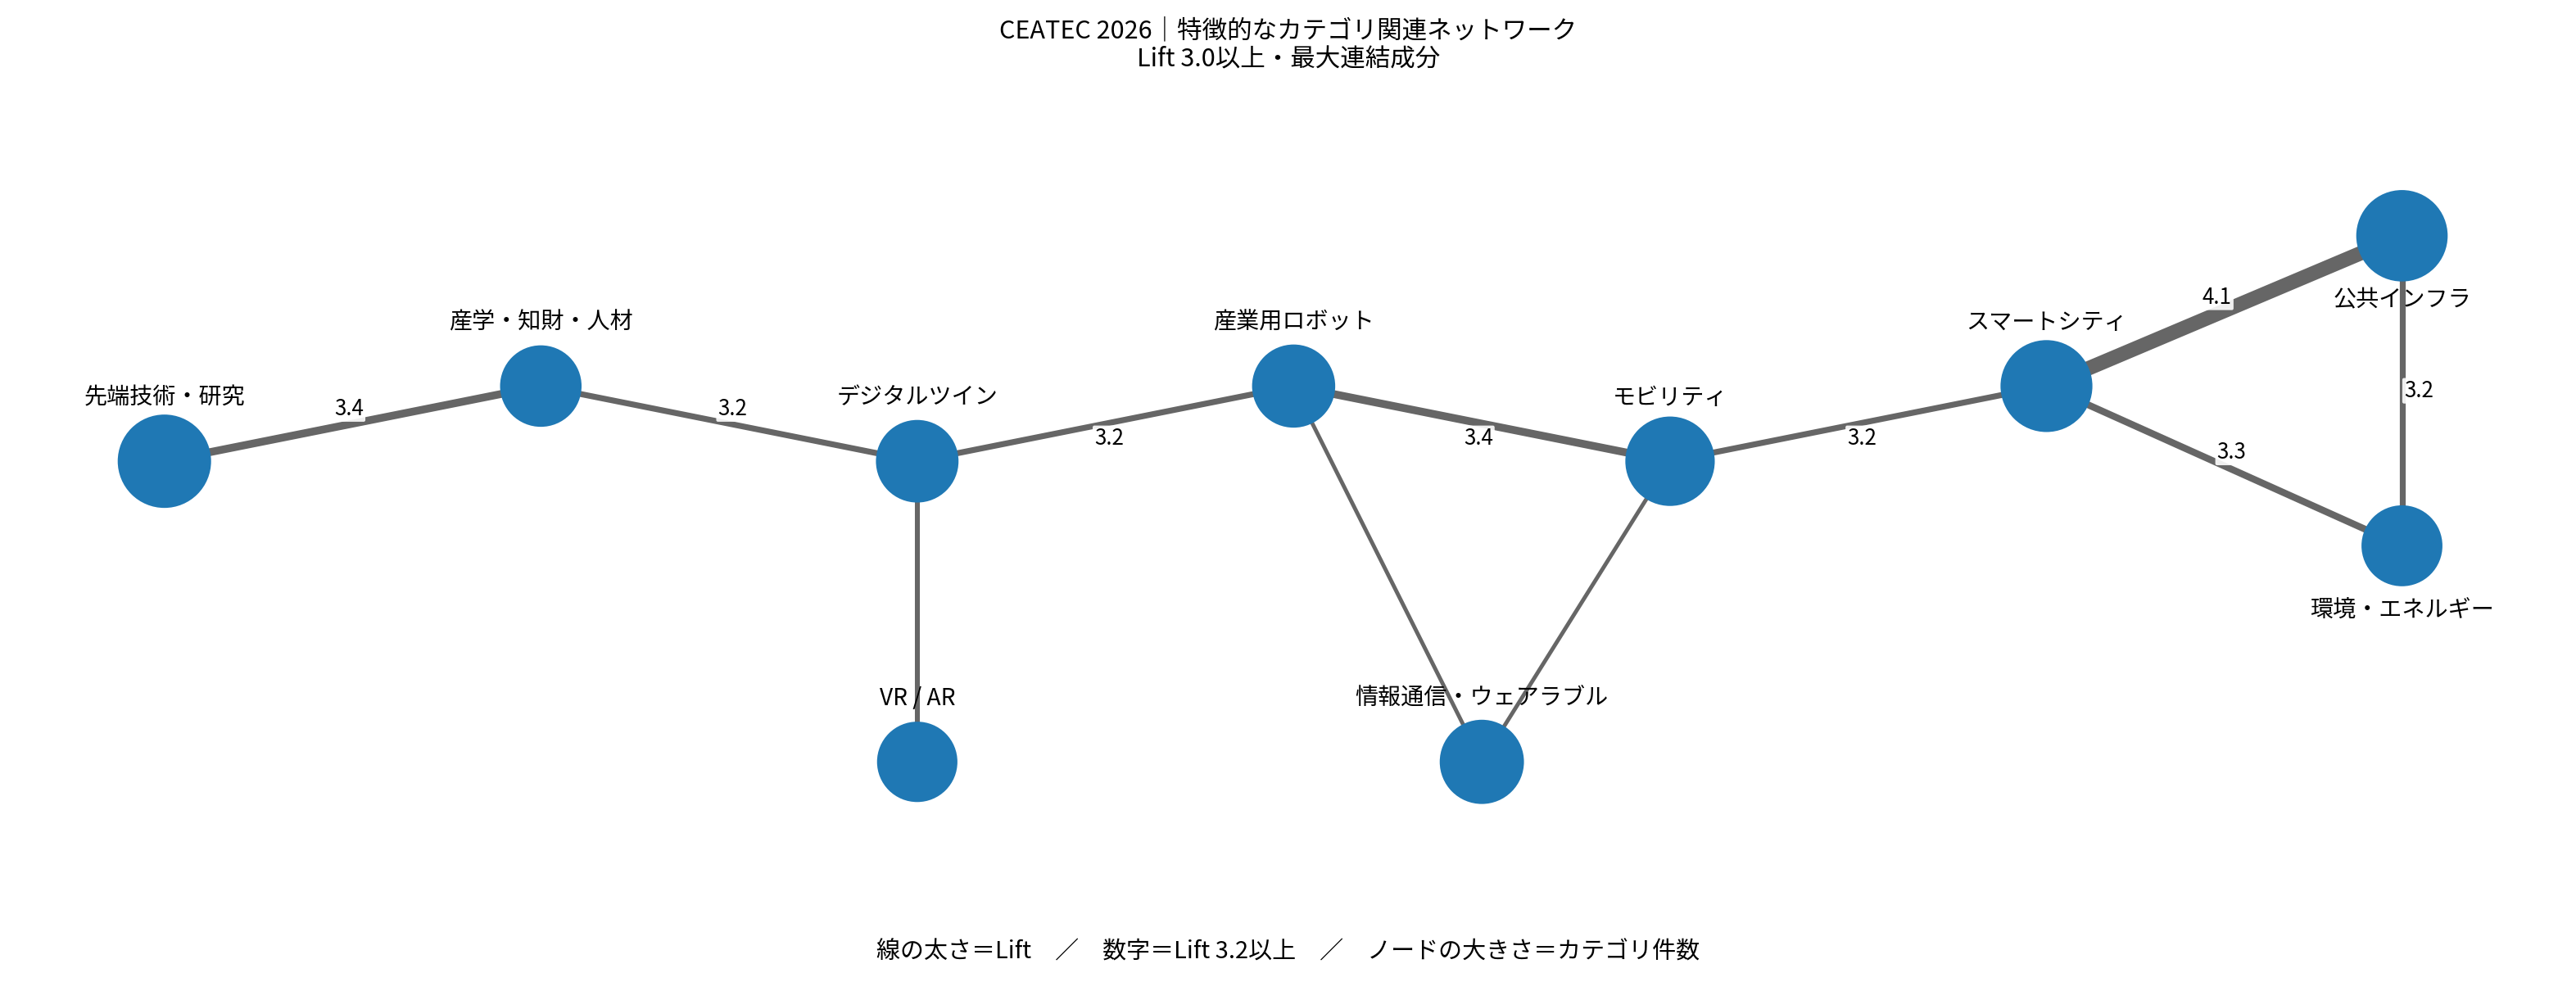
ここで重要なのは、AIが重要ではないということではない。むしろAIは広く行き渡り、単独では展示の違いを説明しにくくなっている可能性がある。対して、スマートシティと公共インフラ、環境・エネルギー、モビリティの結びつきは、個別技術より「社会システムとして実装する場所」にカテゴリが集まっていることを示す。
03 / A SECOND CENTER
CEATECのもう一つの中心は「社会実装の束」かもしれない。
最大Liftはスマートシティ×公共インフラ・サービスの4.10。59社と58社という中規模カテゴリ同士で、独立なら約8.8社の共起が期待されるところ、実際には36社が重なった。
さらにスマートシティは環境・エネルギー(Lift 3.31)、モビリティ(3.18)、IoT(2.72)とも強く結びつく。これは「スマートシティ」という看板の下に、センシング、移動、エネルギー、公共サービスが束として現れている構造と読める。
AIの多さより、「AIの接続先」に違いが出始めている。
AIは172社と最大だが、カテゴリの大きさを補正したLiftでは、上位を独占しているわけではない。これはAIの重要性が低いという意味ではない。むしろAIが幅広い分野に浸透したことで、「AIを使っているか」だけでは出展者の特徴を説明しにくくなり、「AIを何と組み合わせ、どの現場で使うのか」の方に違いが現れている、と読むことができる。
この見方は、個別展示の説明とも整合する。たとえばXGRIDSはLiDAR・カメラ・IMUを使って現実空間を3D化し、建設や設備点検へつなぐ。aiESGは人流・衛星・統計データをAIで統合し、社会的インパクトの評価に使う。技術名そのものより、現実の対象・運用・意思決定への接続が展示価値になっている。
04 / BRIDGES
デジタルツインは、AIと物理世界をつなぐ橋に見える。
デジタルツインは41社と、AIやDXほど大きなカテゴリではない。しかし41社中36社(87.8%)がAIにも分類され、30社(73.2%)がDXにも分類される。一方で、産業用ロボットとのLiftは3.17、VR/ARとは3.09、産学/知財/人材とは3.17だった。
この組み合わせは、デジタルツインが単なる可視化技術ではなく、AIで認識・予測し、ロボットなどの物理系へつなぎ、XRで人が理解するための中間層として使われている可能性を示す。
もちろん、カテゴリが一緒に付いているだけで技術的な因果関係までは証明できない。それでも、41社という比較的小さなカテゴリがAI、DX、ロボット、VR/ARと高い割合で重なることは、デジタルツインが複数技術をつなぐ位置にあることを示す手がかりになる。
05 / WHAT THE MAP SUGGESTS
件数だけでは見えない、CEATEC 2026の構造。
カテゴリ集計だけなら「AIとDXが多い」で終わる。共起数だけなら、大カテゴリ同士が上位になりやすい。期待共起数とLiftを重ねることで、母数の大きさでは説明しにくい結びつきを探せる。
今回の分析からは、①AI/DXの広範な浸透、②スマートシティを中心とするインフラ・モビリティ・エネルギーの強い束、③ソフトウェアとソリューションの実装志向、④デジタルツインを介したAIと物理世界の接続、という4つの読み筋が見えた。
単純な件数ではAIとDXが主役に見える。一方、カテゴリの大きさを補正すると、スマートシティを軸に公共インフラ、モビリティ、エネルギーがまとまって現れる構造や、デジタルツインがAIと物理世界の間に位置する構造が浮かぶ。CEATEC 2026は「どの技術が多いか」だけでなく、「複数の技術がどんな用途のために束になっているか」で見ると、違う姿が見えてくる。
METHOD / SOURCES
データと計算方法
CEATEC 2026公式出展者一覧から取得した390出展者レコードを対象に、公式ページ上の96製品カテゴリを複数ラベルとして集計した。現在の公式サイトでは共同出展者の展開や更新により総数表示が異なる場合があるため、本記事の390は「分析時点で保存したデータセットのレコード数」を意味する。
共起数は同一出展者に2カテゴリが付与された件数。期待共起数は N(A) × N(B) ÷ 390、Liftは 実共起数 ÷ 期待共起数。Lift 1.0は独立仮定と同程度、1.0超は期待より一緒に現れやすいことを示す。カテゴリ付与はCEATEC公式のカテゴリ情報に基づき、TANEMK LABS独自の意味分類ではない。
CEATEC 2026 公式「出展者一覧」
https://www.ceatec.com/ja/exhibition/exhibitor-list.php
参照:CEATEC Association, 「CEATEC 2026 出展者一覧」。本記事は2026年9月に取得した公開情報を対象に分析した。公式ページのURLや内容は将来変更される可能性があるため、参照元の名称・運営主体・取得時期を明記している。
CEATEC 2026 / Exhibitor Category Analysis
Updated: September 21, 2026
AI is everywhere.
But that is not the whole map.
We analyzed 390 exhibitor records and 96 product categories from CEATEC 2026 using category counts, co-occurrence, expected co-occurrence, and lift. AI and DX dominate the surface. The stronger signal appears when we ask which categories occur together more often than their size alone would predict.
01 / THE OBVIOUS LAYER
AI and DX dominate the counts.
AI appears in 172 records and DX in 143, followed by IoT (73), Solutions & Services (69), and Applications/Software (68). That is useful context, but hardly surprising for a technology exhibition in 2026.
AI and DX are already large categories, so they have many opportunities to appear on the same exhibitor record. The next step is to adjust for that size effect.
02 / BEYOND COUNTS
Look for “more together than expected.”
First, we need a baseline: if two categories had no special relationship, how many exhibitors would we expect to carry both? We call that expected co-occurrence. With AI on 172 records and DX on 143 out of 390, the expected overlap is about 63.1 records.
The observed overlap is 104. Dividing 104 by 63.1 gives about 1.65. This ratio is called lift: 1 means roughly as much overlap as expected by chance under independence; 2 means about twice the expected overlap. AI × DX therefore has a lift of 1.65.
| Category pair | Observed | Expected | Lift |
|---|---|---|---|
| Smart City × Public Infrastructure & Services | 36 | 8.8 | 4.10 |
| Mobility × Industrial Robots | 20 | 5.8 | 3.44 |
| Advanced Science/Technology × Academia/IP/Talent | 21 | 6.2 | 3.39 |
| Smart City × Environment & Energy | 19 | 5.7 | 3.31 |
| Smart City × Mobility | 26 | 8.2 | 3.18 |
| Solutions & Services × Applications/Software | 35 | 12.0 | 2.91 |
| IoT × Solutions & Services | 32 | 12.9 | 2.48 |
| AI × DX | 104 | 63.1 | 1.65 |
| DX × Applications/Software | 42 | 24.9 | 1.68 |
| AI × IoT | 48 | 32.2 | 1.49 |
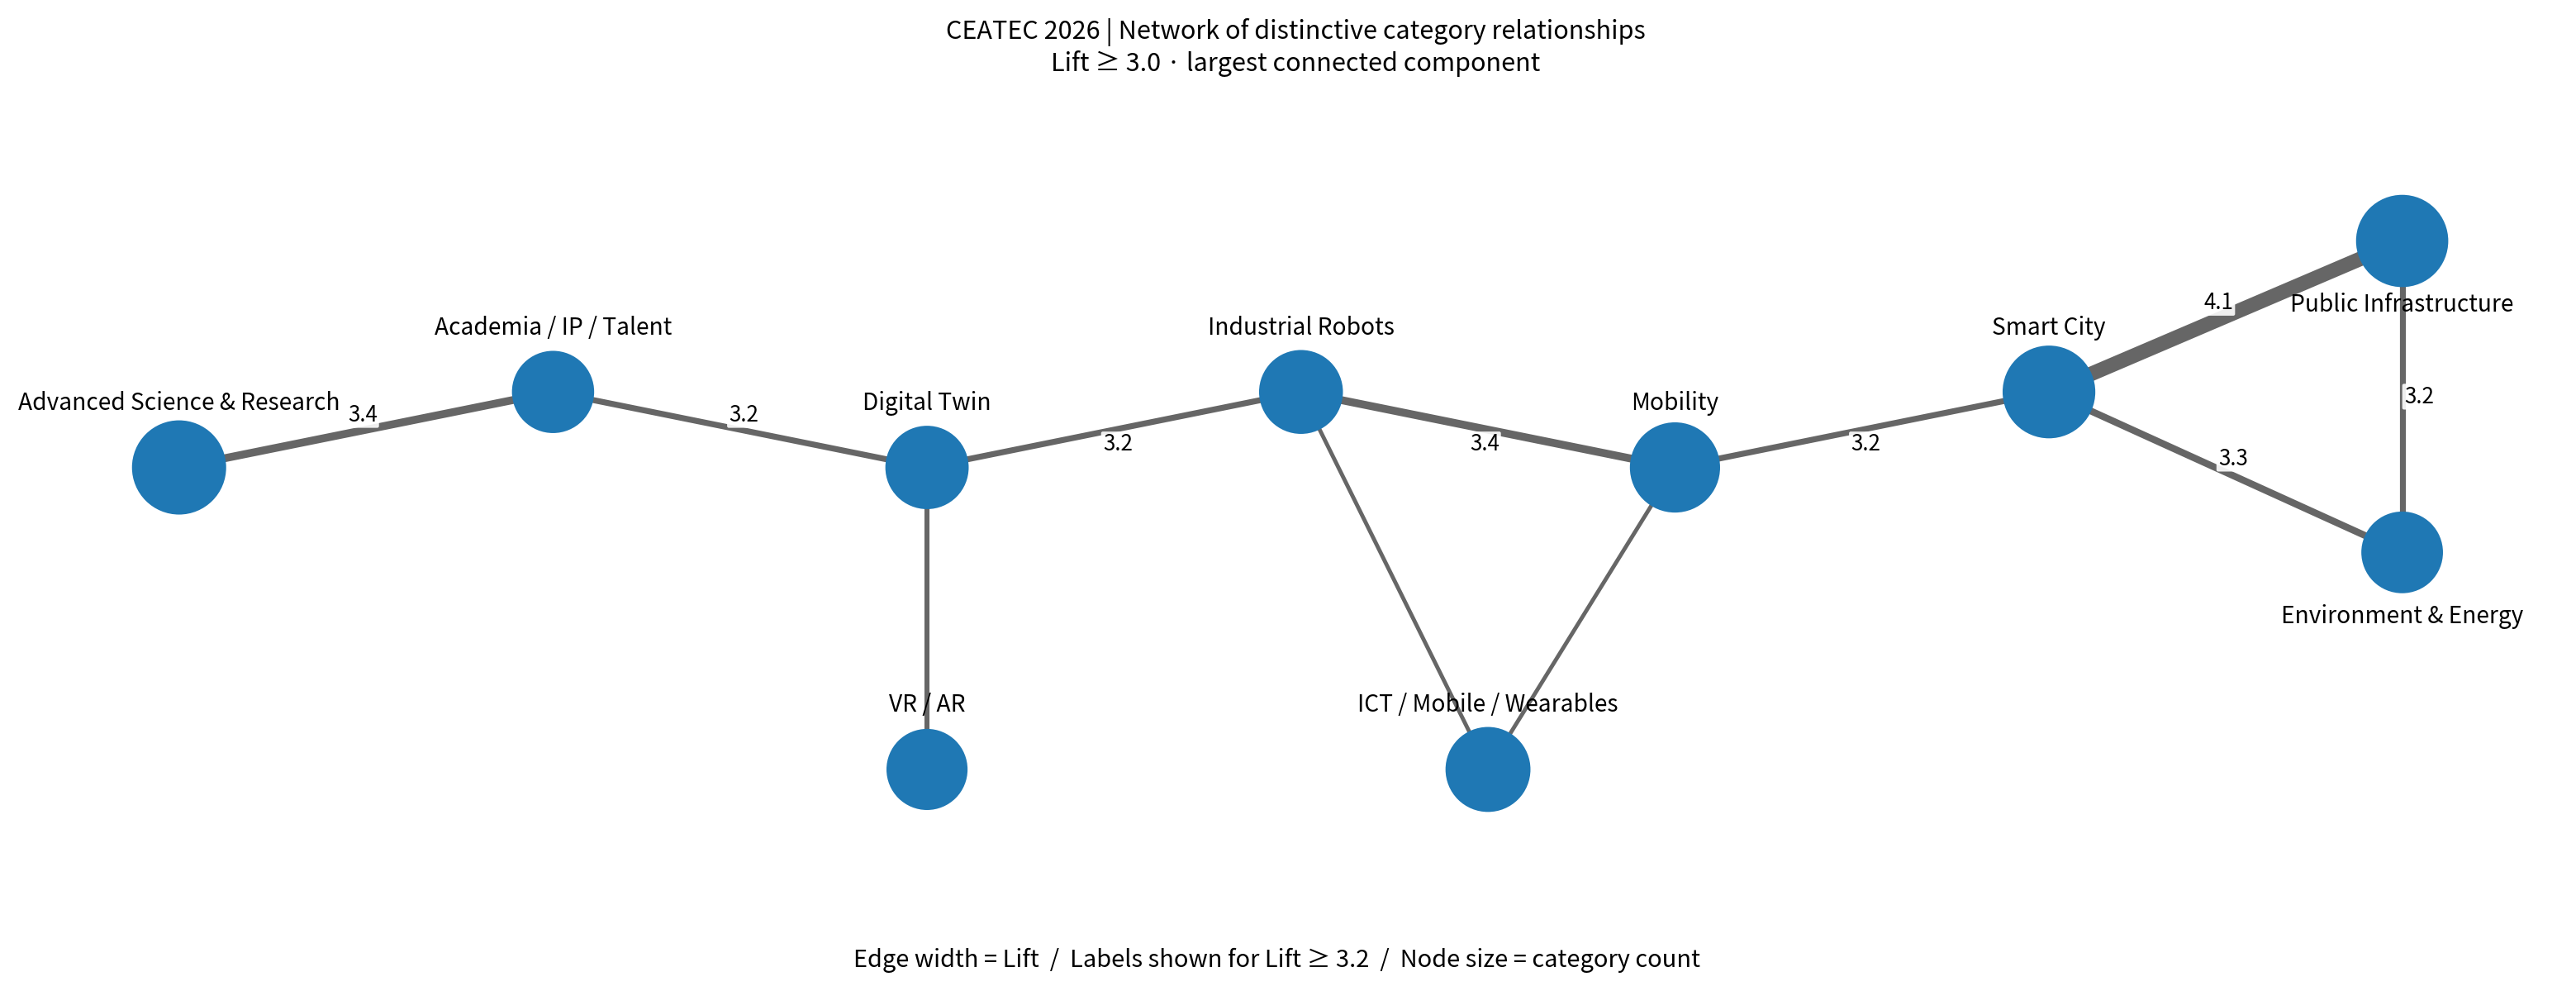
The strongest relationships are not simply AI-to-everything. They cluster around places where technologies have to operate as systems: cities, infrastructure, mobility, energy, and deployable software/services.
03 / A SECOND CENTER
A second center of CEATEC may be the implementation stack.
Smart City × Public Infrastructure & Services has the highest lift in this view: 36 observed overlaps versus 8.8 expected. Smart City also links strongly with Environment & Energy (3.31), Mobility (3.18), and IoT (2.72).
The differentiator may be shifting from AI itself to what AI connects to.
AI is the largest category, but after adjusting for category size, it does not dominate the highest-lift pairs. That does not make AI less important. A more plausible reading is that AI has spread so widely that “uses AI” alone says less about an exhibitor; what matters increasingly is what AI is combined with and where it is deployed.
Individual exhibitor descriptions support this direction. XGRIDS connects LiDAR, cameras and IMU-based spatial capture to construction and infrastructure workflows. aiESG combines people-flow, satellite and statistical data with AI to quantify social impact. The value proposition is increasingly about connecting technology to a real operating context and a decision.
04 / BRIDGES
Digital twins look like a bridge between AI and the physical world.
Digital Twin is not one of the largest categories at 41 records. Yet 36 of those records (87.8%) also carry AI, and 30 (73.2%) carry DX. Its lift is 3.17 with Industrial Robots, 3.09 with VR/AR, and 3.17 with Academia/IP/Talent.
This suggests a role beyond visualization: a layer where AI can perceive and predict, physical systems can act, and spatial interfaces can make those systems understandable. Co-occurrence cannot prove that architecture, but the concentration across these categories is a useful clue that digital twins occupy a connecting position.
05 / WHAT THE MAP SUGGESTS
A structure that raw category counts do not show.
Counts tell us what is common. Co-occurrence tells us what appears together. Lift tells us which relationships are harder to explain by category size alone. Together they point to four threads: broad AI/DX diffusion; a strong smart-city/infrastructure/mobility/energy cluster; a software-to-solution implementation pattern; and digital twins as a possible bridge between AI and physical systems.
By raw count, AI and DX look like the center of CEATEC 2026. After adjusting for category size, another structure becomes visible: public infrastructure, mobility and energy cluster around Smart City, while Digital Twin sits at the intersection of AI and physical systems. The exhibition looks different when we ask not only which technologies are common, but which technologies repeatedly appear as a bundle around the same use cases.
METHOD / SOURCES
Data and calculation
The analysis uses 390 exhibitor records captured from the official CEATEC 2026 exhibitor list and 96 official product categories. The live official page may show a different total as listings are updated or co-exhibitors are expanded; 390 refers to the saved dataset used for this analysis.
Co-occurrence is the number of records tagged with both categories. Expected co-occurrence is N(A) × N(B) ÷ 390. Lift is observed ÷ expected. A lift of 1.0 is consistent with independence; values above 1.0 indicate more overlap than expected. Category labels come from CEATEC's official category information rather than a TANEMK LABS semantic classifier.
CEATEC 2026 Official Exhibitor List
https://www.ceatec.com/en/exhibition/exhibitor-list.php
Reference: CEATEC Association, “CEATEC 2026 Exhibitor List.” This article analyzes public information retrieved in September 2026. Because the live page or URL may change over time, the source title, publisher and access period are stated explicitly.